
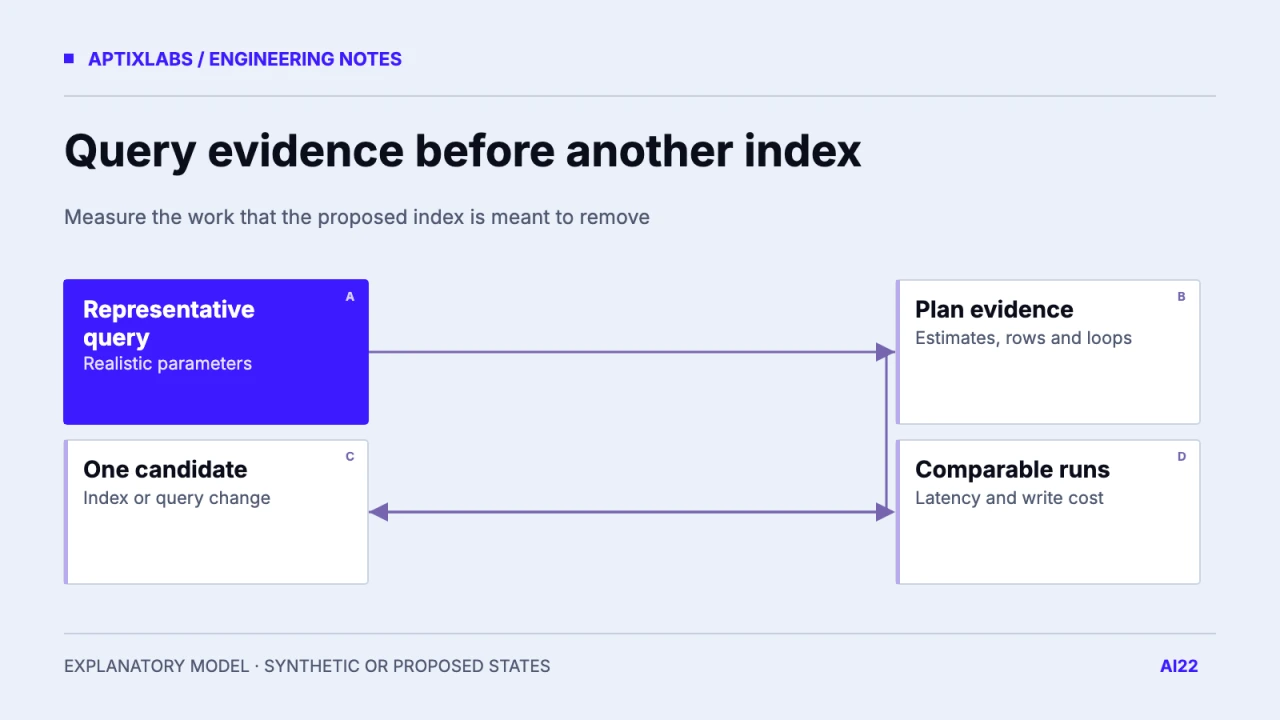
Read the PostgreSQL plan for one representative slow dashboard query before adding an index. Compare estimated rows with observed rows, inspect where work multiplies and test one justified change under comparable conditions. A sequential scan is not automatically wrong, and a lower planner cost is not a measured latency result. Keep query evidence, workload assumptions and observed timings separate.
Capture the query the product really runs
Choose a redacted dashboard request with realistic tenant size, filters and ordering. Preserve parameter types and the database role because casts, policies and prepared statements can influence plans. Record server version, relevant table sizes, statistics freshness and connection context. A query copied into an administrator console with different parameters may explain a different workload from the endpoint users experience.
PostgreSQL's EXPLAIN documentation distinguishes estimated plans from EXPLAIN ANALYZE, which executes the statement and adds actual measurements. For changes with side effects, choose a safe disposable environment and transaction strategy; EXPLAIN ANALYZE is not a harmless display command for arbitrary writes. Machine-readable JSON plans make before/after comparisons easier to retain.
PostgreSQL: EXPLAIN, actual execution and plan interpretation
A synthetic roster-plan worksheet
Imagine a fictional workspace dashboard joining assignments to profiles and deriving recent activity per member. If a nested inner lookup runs once for every assignment, inspect loops and rows together. A small cost per inner execution can become substantial repeated work. Also inspect whether a filter removes many rows late, whether estimates are badly wrong and whether sorting spills under the chosen workload.
-- Illustrative read-only lab query; no plan measurements are claimed.
EXPLAIN (ANALYZE, BUFFERS, FORMAT JSON)
SELECT a.member_id, p.display_name, a.status
FROM fixture_assignments a
JOIN fixture_profiles p ON p.id = a.member_id
WHERE a.workspace_id = $1 AND a.status = 'active'
ORDER BY p.display_name, a.member_id
LIMIT 50;
Use a real bound parameter in the database client; the fragment shows the parameterized query shape, not a psql-ready variable definition. The article deliberately does not invent timing or row-count output. Populate the worksheet from your isolated dataset, with at least a small tenant and a larger tenant so one conveniently selective example does not dominate the decision.
| Question | Evidence to capture | Decision boundary |
|---|---|---|
| Where does work multiply? | Rows × loops by node | Repeated lookup or join work |
| Are estimates reliable? | Estimated versus actual rows | Statistics or selectivity issue |
| Does output dominate? | Returned bytes and serialization | Projection or pagination |
| What does candidate cost? | Read runs, writes and index size | Retain or reject change |
Choose a change that explains the expensive node
If the evidence shows repeated lookups by workspace, status and member, evaluate a matching access path or a query rewrite. If estimates are wrong, inspect statistics and data correlation before blindly adding more indexes. If the product returns thousands of unused columns or rows, reducing output can matter more than a new index. Measure serialization and network time separately from database execution so the dashboard bottleneck is not misattributed.
Check write overhead and index size alongside read behavior. An index that helps an infrequent report may impose maintenance on every transaction. A predicate-specific index can fit a frequent subset, but its query predicate and planner applicability must be verified. Keep one proposed change per comparison when possible; changing query, indexes, pool size and cache together makes causality hard to establish.
Compare under declared conditions
Run the baseline and candidate with the same parameters and record cache state, sample count and concurrency. Report a distribution or the individual runs rather than only the best result. Buffers and planner costs are useful diagnostics, but they are not interchangeable with wall-clock latency. Include any workload setup in the artifact and state whether the result comes from a laptop, staging or production observation.
No PostgreSQL performance fixture was executed for this article. The query and worksheet are proposed evidence collection. A reviewed source query gives a credible shape to investigate, not proof of a bottleneck or a speedup. The final recommendation should identify the expensive node, show how the candidate changes its work and state the measured tradeoff. That is enough for a reviewer to decide whether the added index earns its ongoing cost.
Firestore or PostgreSQL? Start with the product’s data.
Observability for small teams: start with the failed customer task
Bring one API or data workflow and a sanitized failure example for a bounded implementation assessment.
How should you investigate a slow PostgreSQL SaaS dashboard?
Capture a representative parameterized query, compare EXPLAIN estimates with safe actual execution and test one evidence-led change under comparable conditions.
Is a sequential scan always a problem?
No. It can be the right access path for a small table or a query returning a large share of rows.
Is EXPLAIN ANALYZE read-only?
It executes the statement. Use a safe environment and inspect side effects before applying it to anything beyond a reviewed read.